A compact scenario model for a 1-week U.S. government shutdown and show a clear, sourced estimate range for the GDP hit plus short notes on persistence and sectoral effects.
Quick headline numbers (1-week shutdown)
Using recent government/market estimates and current U.S. GDP (~$30.5 trillion nominal), a 1-week shutdown would likely trim U.S. GDP by about $7.6B — $15.3B for that week, depending on the damage assumption:
- Conservative scenario (−0.1 percentage point of annualized GDP/week): ≈ $7.6 billion lost.
- Baseline / commonly cited (−0.15 ppt/week): ≈ $11.4 billion lost.
- Higher-impact scenario (−0.2 ppt/week; CEA/White House calc): ≈ $15.3 billion lost.
How I computed this
- I used nominal U.S. GDP ≈ $30.507 trillion (2025 estimates).
- A “0.1–0.2 percentage point” weekly drag is commonly used by analysts (Goldman, Fed conversations, CEA). To convert a ppt of annualized GDP into a dollar level cost for one week I:
- compute 0.1% / 0.15% / 0.2% of annual GDP, and
- divide that annual dollar amount by 4 (to convert an annualized-quarter effect into the quarter’s level), which yields the per-week dollar loss used above. Example (0.2%): 0.002 × $30.507T = $61.014B annual → /4 ≈ $15.25B for that quarter/week effect.
Which estimate is most likely?
- Many forecasters point to ~0.1–0.15 ppt per week as the plausible short-run effect for a typical, short shutdown, so the $7.6B–$11.4B band is a reasonable central range. Goldman Sachs and several outlets quote ~0.15 ppt/week. The White House CEA places the upper-bound near 0.2 ppt/week (their memo gives ~$15B/week).
How much of that is permanent (never recovered)?
Past evidence (CBO on the 35-day 2018–19 shutdown) shows some of the lost output is temporary (recovered after restart) while a fraction is permanent. In 2019 the CBO found a 35-day shutdown cost roughly $11B, with about $3B effectively permanent (≈27%). For a short, 1-week shutdown the permanent share is likely smaller, but to be conservative you might assume ~10–30% of the one-week loss could be permanent (due to canceled projects, lost investment, supply-chain pain and bankruptcies). That implies permanent loss ≈ $0.8B–$4.6B across the conservative→high scenarios; a narrower, plausible band is ~$0.8B–$2.9B if you use the 25% midpoint.
Distribution & short-term effects (qualitative)
- Federal workers & contractors: furloughs reduce payroll spending; contractors face delayed payments. Consumer spending in affected regions (Washington metro, contract hubs) will dip.
- Travel & tourism: travel industry groups estimate ~$1B/week damage from closed national parks, delays, cancelled tours — an outsized hit for local economies.
- Data & approvals: regulatory approvals, loan guarantees, and government grants pause — this delays private investment and can amplify longer-run losses if projects are postponed.
Uncertainties & caveats
- Duration matters: one week is short — most lost activity is likely recouped after reopening, so the net long-run damage is materially smaller than the headline weekly number.
- Debt-ceiling or default risk: If this shutdown escalates into debt-limit brinkmanship, economic costs could be far larger than these estimates. (This model assumes no default risk.)
- Policy offsets: retroactive pay to furloughed workers (standard practice) or one-time federal relief can partially offset consumption losses.
- Spillovers: state/local effects, confidence channels, and delayed corporate decisions can add further drag if businesses pull back hiring/investment beyond the shutdown window.
Bottom line (one-sentence)
A 1-week U.S. government shutdown would probably shave roughly $8B–$12B off U.S. GDP in the short run (with a plausible range $7.6B–$15.3B), of which a smaller slice — perhaps a few hundred million to a few billion dollars — might be permanent depending on how disruptive the shutdown is.
Created a simple spreadsheet-style model showing the GDP impact of a 1-week U.S. shutdown, including conservative, baseline, and high-impact scenarios, with weekly and estimated permanent losses.
Here’s what the table looks like:
| Scenario | Annualized Loss ($B) | Weekly Loss ($B) | Estimated Permanent Loss ($B) |
|---|---|---|---|
| Conservative (0.1 ppt) | 30.507 | 7.627 | 1.907 |
| Baseline (0.15 ppt) | 45.761 | 11.440 | 2.860 |
| High-impact (0.2 ppt) | 61.014 | 15.254 | 3.814 |
- Weekly Loss: estimated immediate economic drag for the 1-week shutdown.
- Estimated Permanent Loss: roughly 25% of weekly loss that may not be fully recovered.
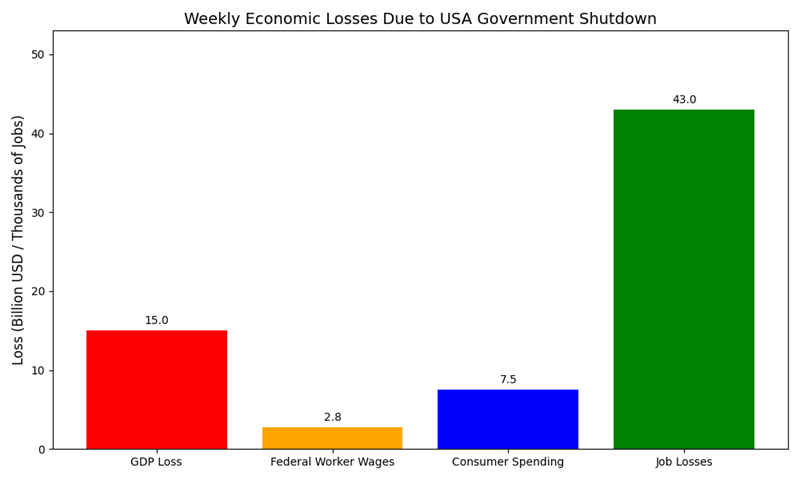
Roughly breakdown of economic losses due to the USA government shutdown

- GDP Loss: $15 billion/week
- Federal Worker Wages: $2.8 billion/week
- Consumer Spending: $7.5 billion/week
- Job Losses: 43,000 (monthly estimate)
